Laying out a wildlife transect
Define a target and sampling frame, position lines without following the animals, specify line or strip rules, record effort and perpendicular distance where required, and call simple sightings per kilometer an index rather than abundance.
Last updated
Place lines before detections guide you
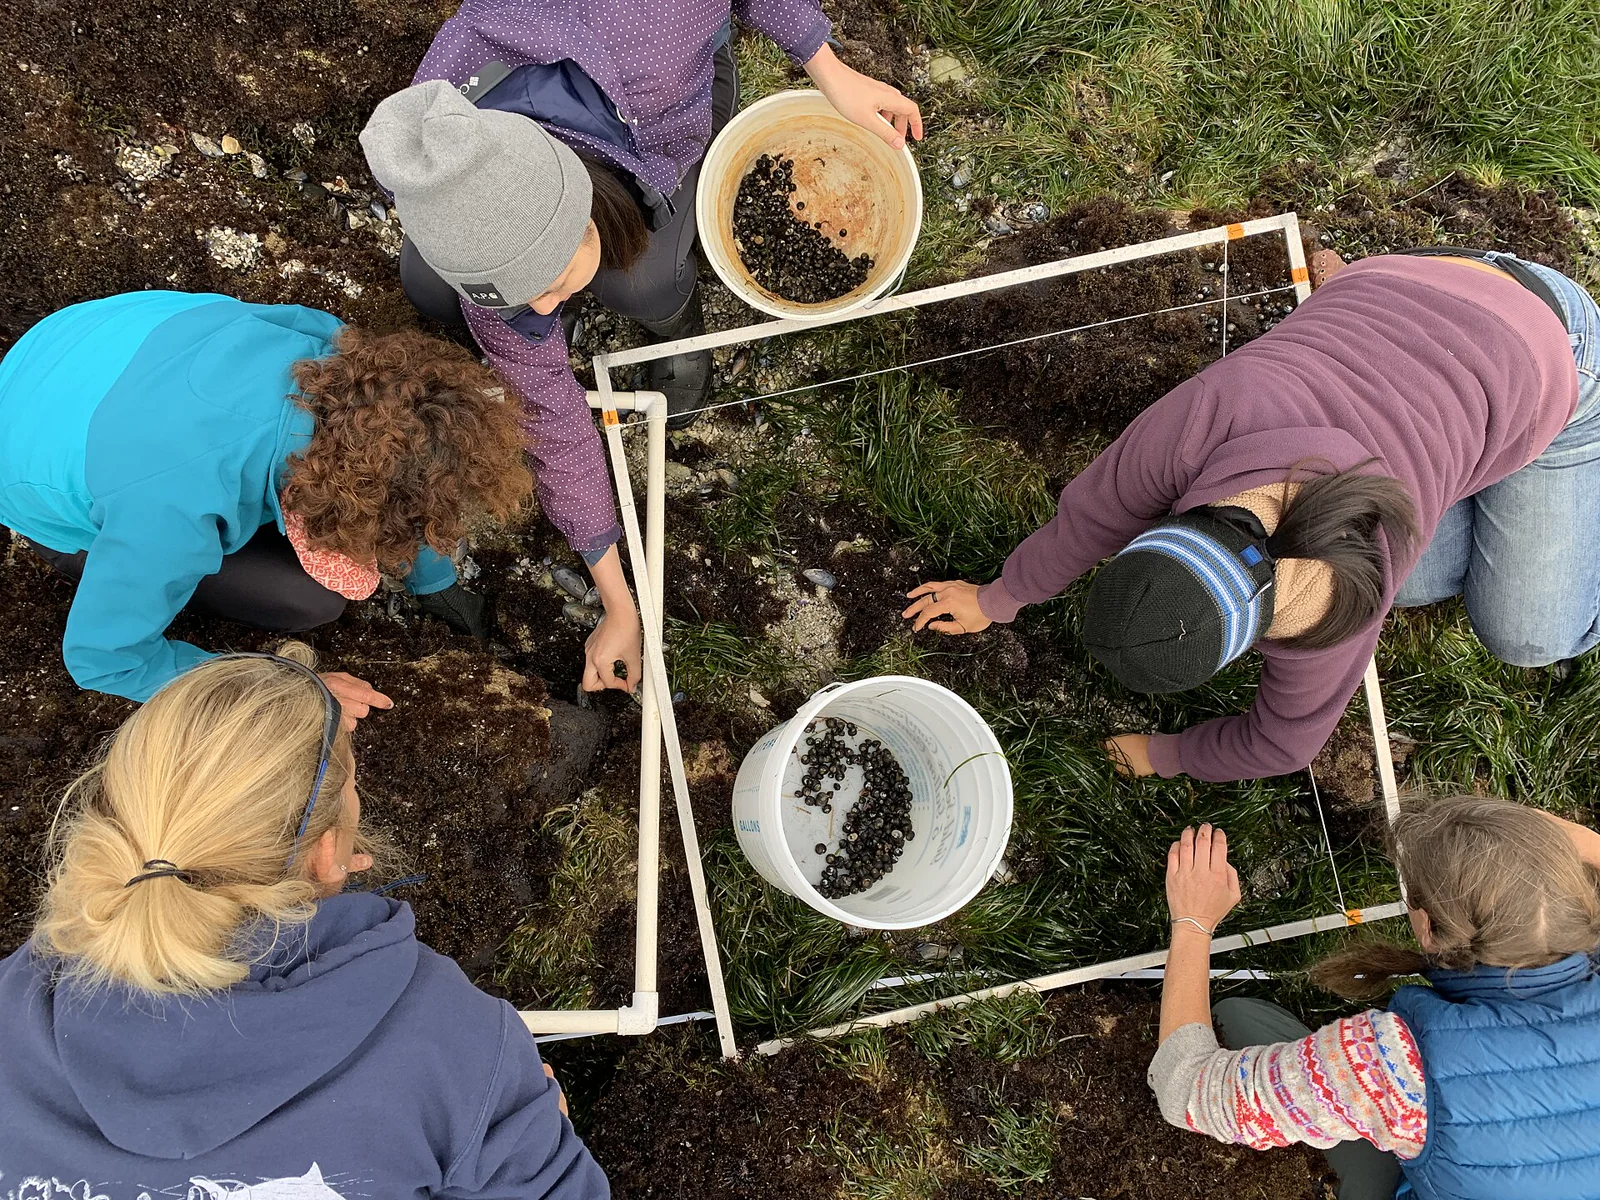
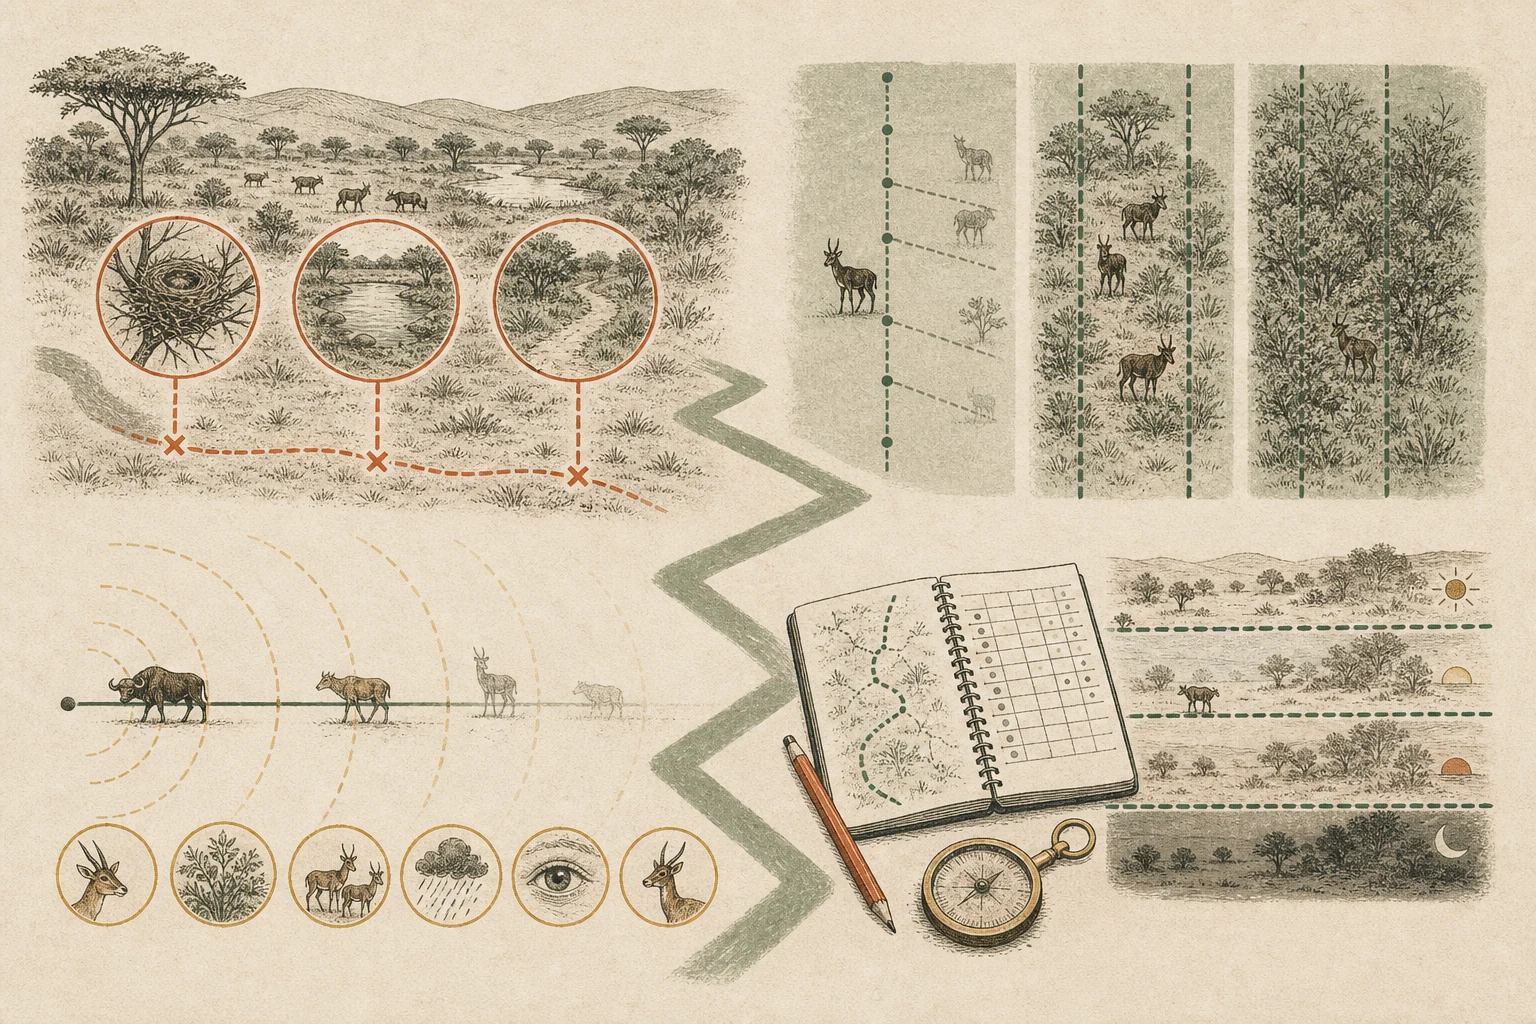
Before unspooling a fiberglass tape across a rocky intertidal bench or walking a compass bearing through sagebrush steppe, define the exact study boundary you want your routes to represent. Routes that curve along existing footpaths, follow creek bottoms, or bend toward active burrows and fruiting trees sample those convenient corridors rather than the wider landscape. Instead, lay out multiple shorter, replicated lines using random starting coordinates, parallel systematic spacing from a random origin, or habitat strata that divide open meadow from closed canopy. Orienting lines across major environmental gradients—such as perpendicular to a shoreline or elevation contour—prevents a single transect from sitting entirely inside one narrow band. [1][2]
- Establish start points and compass bearings on a map before entering the field so sightings never steer your path.
- Prefer a dozen shorter, independent lines dispersed across the site over one marathon walk along a favorite trail.
- Run lines perpendicular to shoreline, moisture, or elevation gradients when you want each line to cross the full habitat profile.
Line, strip, and belt are not interchangeable
Walking a route without declaring its lateral rules mixes incompatible survey methods. On a line transect, the observer stays on the centerline and records every detected target along with its perpendicular distance from the line—or radial sighting distance plus bearing angle so perpendicular distance can be calculated. On a fixed-width strip or belt transect, such as a two-meter band searched for tortoise burrows or fallen-log salamanders, you tally only objects inside the boundary walls and assume detection is nearly complete within that narrow corridor. Specify before starting whether your basic unit is an individual animal, a cohesive cluster, or a fresh sign, and avoid double-counting individuals that flush ahead along the line. [2][3]
- Use narrow strip or belt transects only when cover is open enough that you rarely miss targets inside the strip boundary.
- For line transects, measure or trigonometrically derive the perpendicular distance from the line to the animal's initial position.
- Record tightly associated flocks or herds as clusters with a group-size tally rather than independent single points.
Detection usually falls with distance
Even on open grassland or calm coastal water, a sitting jackrabbit, warbler, or harbor porpoise fifty meters off the centerline is much easier to overlook than one directly on your path. Detectability also shifts with shrub height, wind noise, sun angle, group size, animal behavior, and observer acuity. Formal distance sampling estimates density by fitting a detection function to those declining perpendicular distances, which depends on detecting animals right on the line with certainty, recording their undisturbed initial positions before they flush or approach, and measuring distances accurately. Never wander off the transect line to chase a mystery call or confirm a distant silhouette, because leaving the line corrupts the search geometry. [3][4]
- Mark the spot where an animal was first detected before it moved in response to your approach.
- Use a laser rangefinder and compass bearing rather than guessing perpendicular distances by eye.
- Stay strictly on the centerline during the walk; log distant unconfirmed sightings as unidentified rather than detouring off route.
Repeat effort before comparing rates
Raw transect tallies mean little unless paired with effort and observation conditions. On every walk, record exact line length, start and finish times, walking pace, pause rules, observer identity, wind, temperature, cloud cover, and glare. Dividing total detections by kilometers walked produces an encounter-rate index—such as raptors or deer per kilometer—which is useful for tracking relative activity along the same routes when timing and visibility stay comparable. However, an encounter rate can rise or fall simply because wind quieted songbirds or dry grass improved sightlines. Converting sightings per kilometer into true animals per square kilometer requires an explicit detection model and a defined sampling frame. [1][4]
- Keep walking speed, time of day, and observer roles consistent across repeat walks of the same transect network.
- Log transects with zero detections just as carefully as busy lines so total effort and nondetections remain intact.
- Label simple counts per kilometer as an encounter index unless you have measured distances and modeled imperfect detection.
Related guides
Get Fauna and identify it in the field.
Where this guide comes from
Source-checked editorial guide. Last updated . This guide teaches identification and field skills; it is not a substitute for expert verification when it matters.