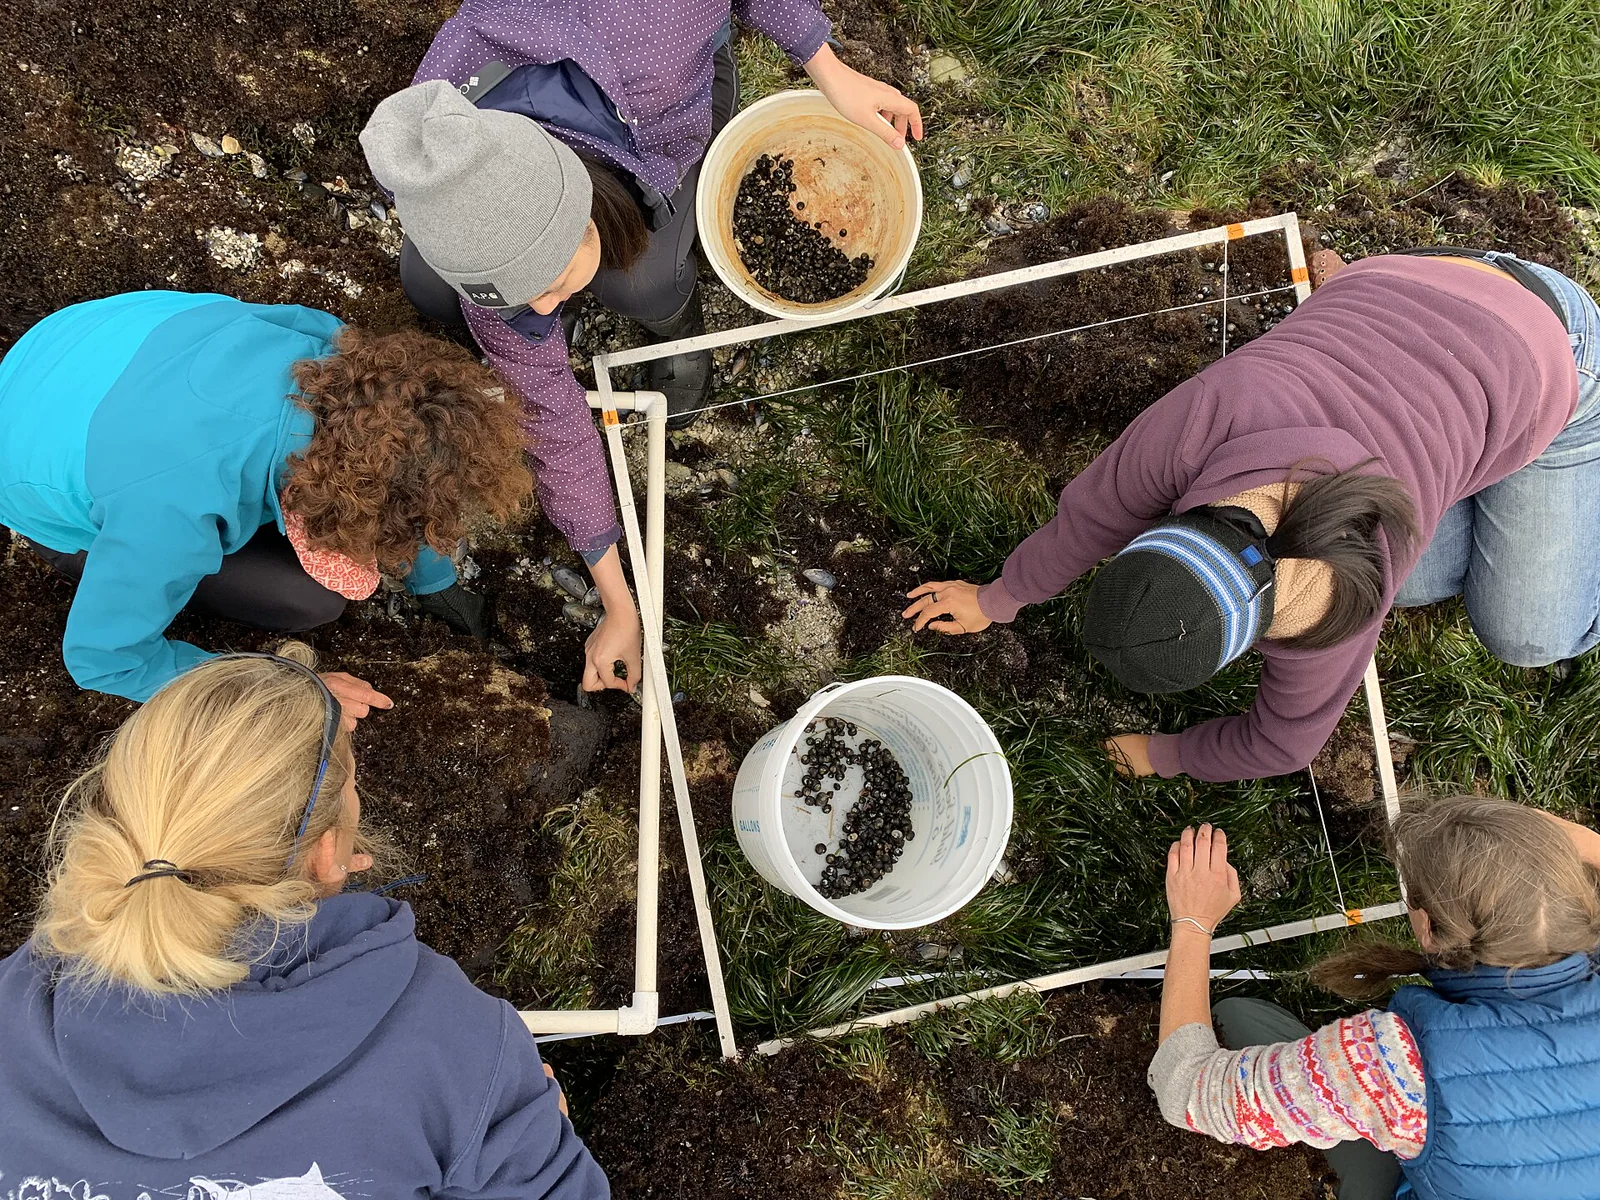
Using a quadrat for biodiversity
Choose an area suited to the organisms, place replicated quadrats by a declared random or systematic rule, use one edge convention, record the same response each time, and limit conclusions to the sampled design.
Last updated
Match the frame to the question
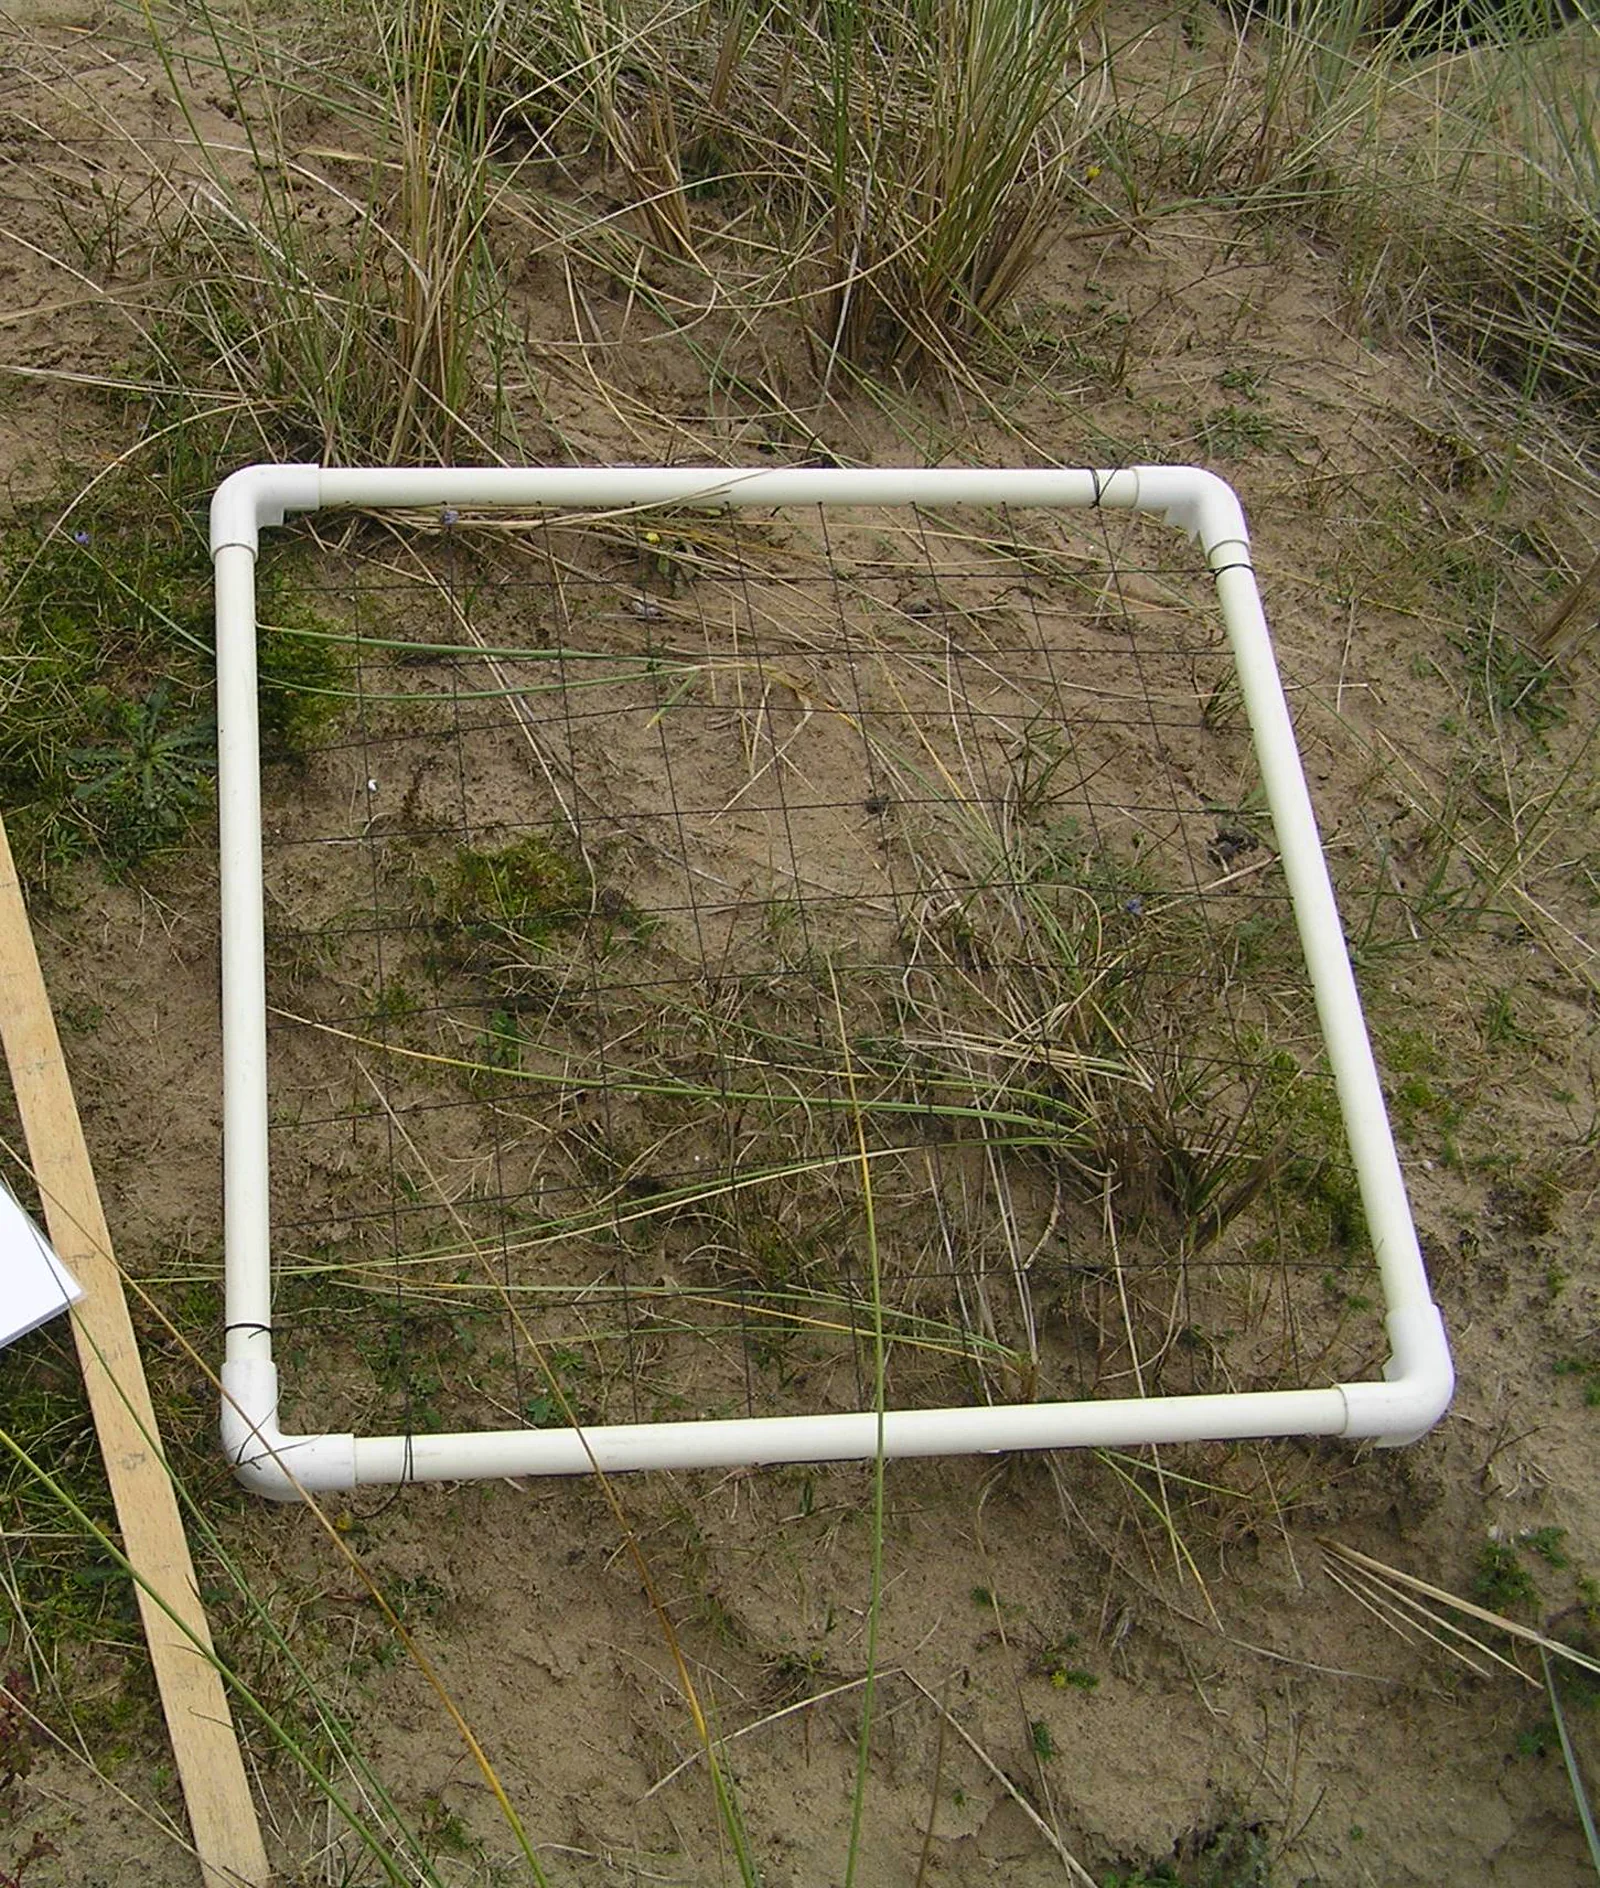
Kneeling beside a wave-washed tidepool boulder or a cushion of forest-floor mosses makes scale tangible right away: a compact ten-by-ten-centimeter frame resolves dense acorn barnacles, crustose lichens, and tiny periwinkles, whereas a half-meter or one-meter square is better suited to meadow wildflowers, bunchgrasses, or desert subshrubs. If the frame is too small relative to the organisms, most plots fall empty or capture only a single clump; if it is too large, counting takes so long that observer fatigue creeps in. Before laying the first square, define the target taxonomic group, frame dimensions, internal string subdivisions, and exact response variable—individual counts, visual percent cover, grid-cell frequency, or species richness—and keep that metric constant. [1][3]
- Size the frame to the organisms: small subdivisions for dense barnacles or moss mats, larger squares for herbs and low shrubs.
- Stringing a frame into a ten-by-ten or five-by-five subgrid turns tricky cover estimates into repeatable cell tallies.
- Decide before sampling whether you are recording individual counts, percent cover, frequency across cells, or species lists.
Placement controls what the sample represents
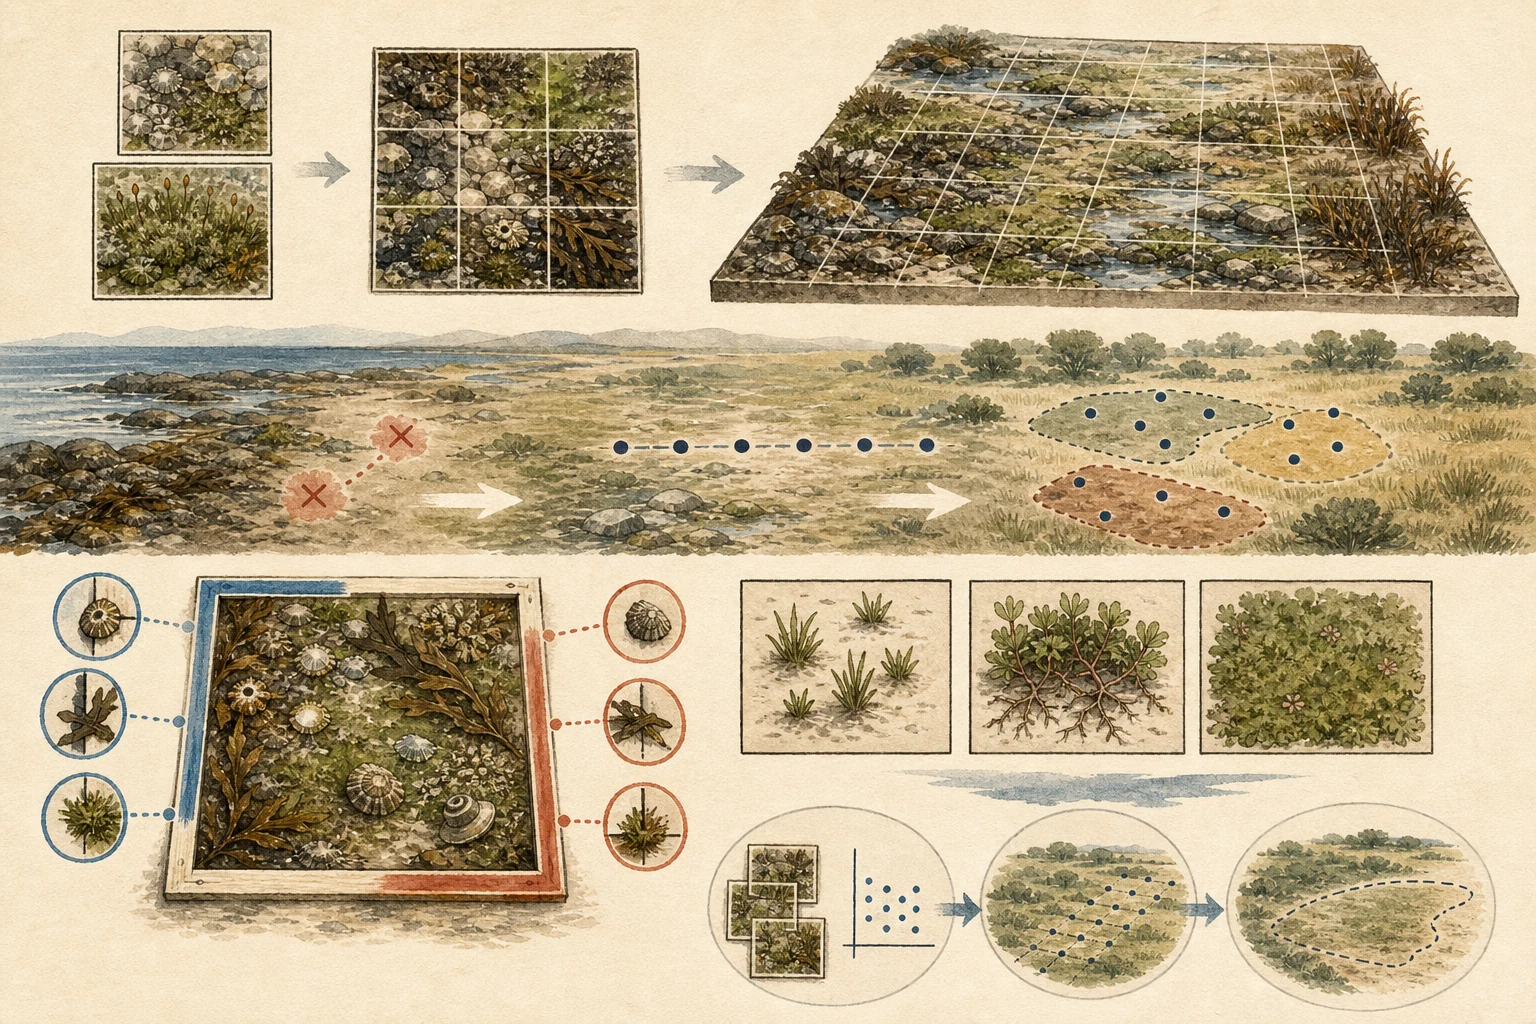
Tossing or setting a quadrat by eye almost always pulls the frame toward colorful flower clusters, crowded tidepool crevices, or easy footing, which inflates richness and cover compared with the surrounding habitat. Instead, establish a clear spatial rule before entering the patch: draw random coordinate pairs along two taped baselines, space frames at fixed intervals along a meter tape across an intertidal bench, or stratify plots separately between high-marsh and low-marsh zones. Replicate enough independent squares across each zone to capture natural patchiness rather than relying on one or two lush frames. When tracking recovery after fire or storm surge across seasons, permanently staked plots measure change within exact spots, whereas freshly randomized plots compare broader site averages. [2][3]
- Use random number pairs or fixed tape intervals rather than dropping the frame by hand or choosing lush patches.
- Stratify your sampling when a site crosses distinct zones such as upper barnacle rock versus lower algal turf.
- Match your plot spacing to the grain of the habitat so adjacent frames do not repeatedly sample the same clone or boulder.
Use one edge and counting rule
Once the frame rests on the substrate, boundary decisions determine whether counts stay consistent from plot to plot. Limpets, rosettes, and cushion plants frequently straddle the PVC or wire rim; adopt a strict two-edge convention—such as counting individuals touching the north and west bars while excluding those on the south and east bars—so edge straddlers are neither double-counted nor systematically ignored. For matting plants, creeping stems, or colonial ascidians where single individuals are indistinct, state in advance whether you are scoring rooted ramets, canopy overlap, or grid-intersection hits. Scan every subcell in the same serpentine order for a comparable search time, and take an overhead vertical photograph with a plot label to back up field identifications. [1][4]
- Apply one boundary convention on every square, such as including organisms on the top and left edges while excluding bottom and right.
- Specify whether clonal plants and colonial invertebrates are scored by rooted shoots, basal attachment, or surface cover.
- Search subgrid cells in a fixed sequence so cryptic snails or seedlings receive equal visual effort in every plot.
Keep inference inside the sampled area
Quadrat tallies summarize the exact squares you inspected under your placement design—whether expressed as mean individuals per square meter, proportion of occupied frames, or cumulative species observed across twenty plots. Multiplying a sample mean up to an entire hillside or shoreline requires that every corner of that larger target area had a known probability of being sampled, and any total estimate should carry its variance or confidence interval alongside it. Remember too that fixed frames measure sessile or slow-moving organisms: beetles, shore crabs, grasshoppers, and lizards dart out as your shadow falls across the plot, so mobile wildlife requires transects, traps, or timed area searches rather than static quadrats. [2][4]
- Report sample size, frame dimensions, placement rule, and variation alongside any average density or cover figure.
- Avoid extrapolating plots from one convenient trail edge or tidepool shelf to an entire meadow or rocky headland.
- Do not use static quadrat counts to estimate populations of mobile insects, crabs, amphibians, or vertebrates that flee on approach.
Related guides
Get Fauna and identify it in the field.
Where this guide comes from
Source-checked editorial guide. Last updated . This guide teaches identification and field skills; it is not a substitute for expert verification when it matters.