How to read a species range map
A colored polygon is a claim made at a particular scale, season, and date—not a promise that the species occupies every point inside it.
Last updated

Name the kind of map
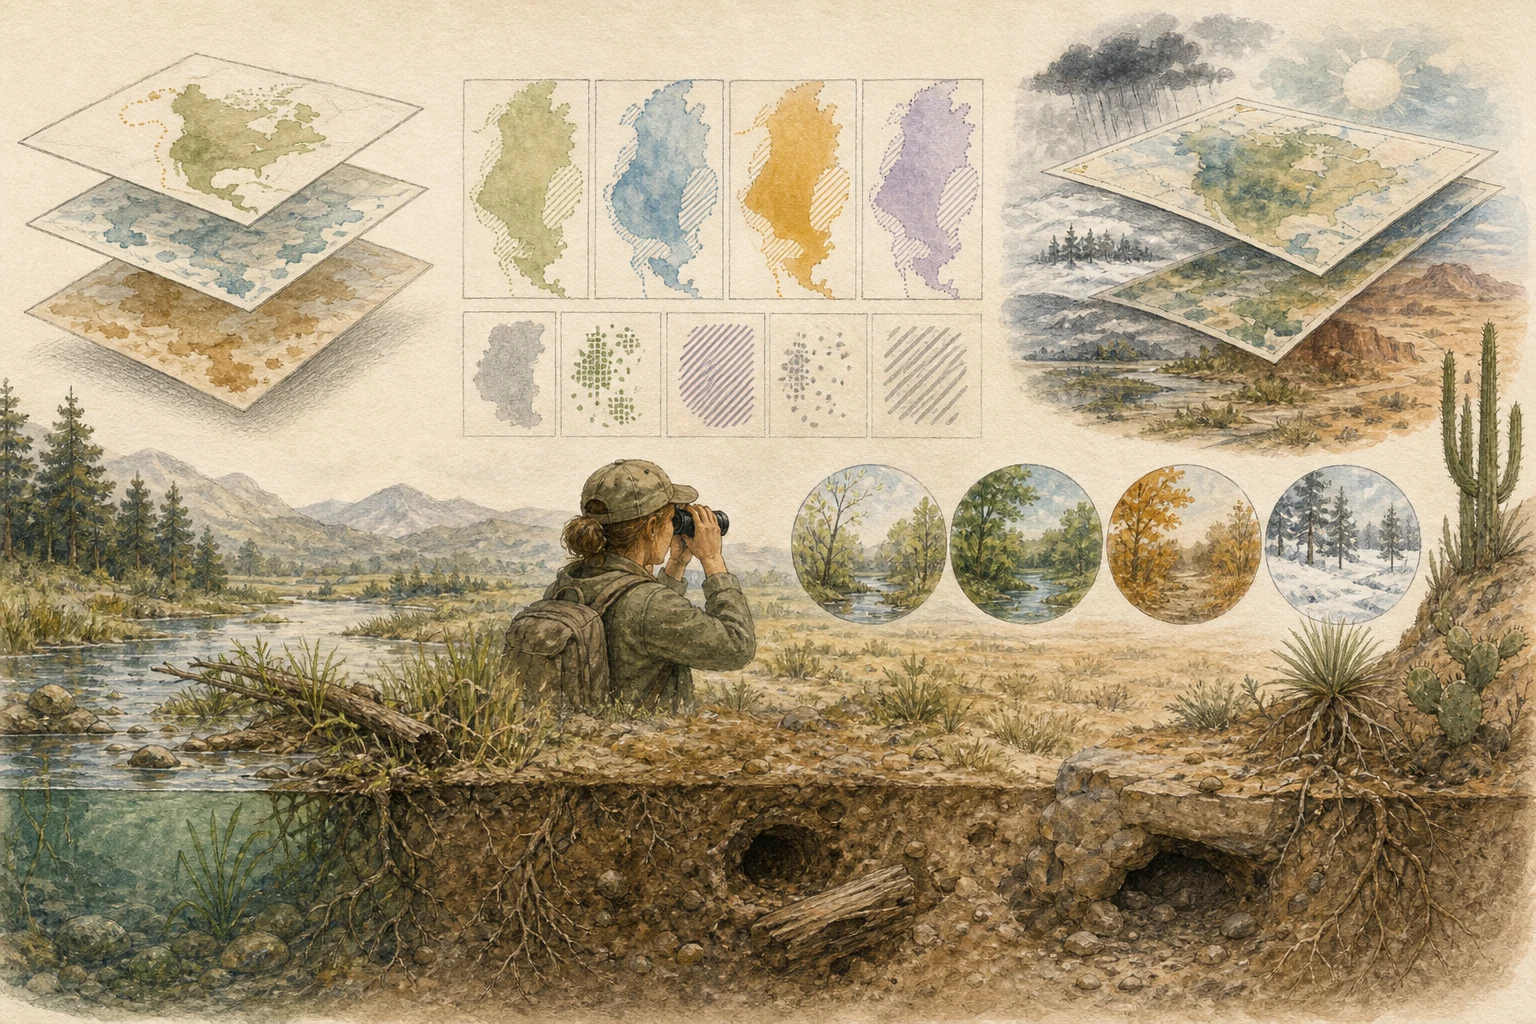
Before trusting a shaded shape in a field guide or online atlas, check what kind of spatial layer you are actually reading. A classical range map draws a coarse outer envelope around the broad geographic limits within which a species is known or expected to occur. A predicted-habitat distribution layer asks a narrower question by modeling where mapped environmental conditions—such as forest cover, elevation, and moisture—are suitable for the organism; in U.S. Geological Survey GAP products, those suitable patches are modeled inside the known species range, whereas other modeling projects apply different rules. Point-occurrence maps plot verified specimen or sighting records without claiming continuous presence between dots. Reading the title and methods prevents you from confusing a broad envelope with a fine-grained habitat map. [1][3][5]
- Field check: read the map caption and methods note to see whether you are looking at a range envelope, modeled habitat, or plotted point records.
- Common trap: assuming a solid color polygon means a wood thrush, salamander, or oak grows in every acre inside the boundary.
- Cross-reference a broad range polygon with a predicted-habitat layer or local sightings before expecting a specialist species in unsuitable terrain.
Decode season, origin, and presence
Colors, stippling, and hatching carry distinct biological meanings that vary from one publisher to another. Bird atlases and eBird Status and Trends products routinely separate breeding, nonbreeding, migratory passage, and year-round occurrence, while IUCN Red List spatial layers distinguish where a taxon is extant, possibly extant, or uncertain, alongside origin categories such as native, introduced, or reintroduced. A wood warbler or shorebird mapped across your county solely during spring and autumn passage will not be holding territory in July, and a reintroduction polygon may reflect a single managed release site rather than widespread presence. Always open the publisher's own legend and metadata panel before heading into the field. [1][3][4]
- Field check: match your observation date against seasonal color codes for breeding, wintering, and migratory passage before flagging an out-of-range bird.
- Check IUCN origin and presence codes so you do not confuse historic, introduced, or uncertain areas with native extant populations.
- Remember that terms like 'possible' or 'nonbreeding' follow publisher-specific rules explained in the accompanying documentation.
Respect scale and uncertainty
Every wildlife map inherits the spatial resolution, time period, and sampling biases of the underlying records and environmental layers. U.S. Geological Survey GAP distribution maps, for example, are built for landscape- and regional-scale conservation planning rather than proving presence or absence on a single trail or small parcel, and predictive accuracy differs substantially across species. Similarly, statistical abundance and habitat models depend on observer effort, remotely sensed covariates, and modeling assumptions from a specific window of years. Pinch-zooming a digital range map on a smartphone screen enlarges the graphic boundary without adding local ecological precision that the source dataset never contained. [2][4][5]
- Field check: check the spatial resolution and publication date of a map before using it to judge a small park or single hillside.
- Common trap: zooming tightly into a continental range boundary and treating the pixel edge as a literal fence line on the ground.
- Account for observer coverage gaps in remote habitats where sparse sightings can make a model underpredict actual occurrence.
Turn the map into a field hypothesis
The most productive way to use a range map outdoors is to treat it as a starting hypothesis that you test against real habitat on the ground. Before deciding whether a candidate identification makes sense, ask whether your exact elevation, plant community, microclimate, and calendar date match what the species requires. Compare a current authoritative range map with recent dated checklists and local habitat structure. Standing inside a mapped polygon never guarantees that a patch is occupied, while a well-documented sighting outside a mapped edge could represent natural dispersal, a shifting range boundary, an unmapped microhabitat pocket, or a look-alike species that warrants careful verification. [2][3][4][5]
- Field check: combine the map with your immediate elevation, vegetation structure, and season to judge whether a candidate species is plausible.
- When an animal appears outside its mapped range, capture clear multi-angle photos or audio and check look-alike native relatives first.
- Compare older printed guide maps with dynamic seasonal models and recent verified records to spot ongoing range shifts.
Related guides
Get Fauna and identify it in the field.
Where this guide comes from
Source-checked editorial guide. Last updated . This guide teaches identification and field skills; it is not a substitute for expert verification when it matters.